How to deploy Prometheus on Kubernetes using helm-part1
Introduction
In the fast-paced world of Kubernetes, effective monitoring and visualization are crucial for maintaining optimal application performance. While Kubernetes orchestrates container environments, it alone isn’t enough for seamless operation. Enter Prometheus and Grafana, the dynamic duo that offers deep insights into cluster utilization and performance metrics.
In this blog post, you’ll learn how to integrate these essential monitoring tools effortlessly using Helm. We’ll guide you through setting up Prometheus to collect metrics, using Grafana for insightful visual dashboards, and managing alert rules to proactively address issues. Whether you’re new to monitoring Kubernetes or seeking to enhance your existing setup, this guide provides the tools you need to ensure your applications perform flawlessly under any conditions. Get ready to transform your approach to Kubernetes monitoring!
What is Prometheus?
Prometheus is an open-source monitoring and alerting toolkit that falls under the CNCF (Cloud Native Computing Foundation) umbrella. It features a powerful time-series database optimized for high performance in storing and querying metrics data.
Prometheus employs a pull-based method for metrics collection, actively retrieving data from application endpoints and servers at predefined intervals. This approach offers real-time insights into the health and performance of the systems being monitored. Additionally, Prometheus supports dynamic discovery of targets using various mechanisms, including Kubernetes service discovery, enhancing its effectiveness in dynamic environments.
Why Use Prometheus for Kubernetes Monitoring?
Prometheus is a preferred choice for Kubernetes monitoring for several compelling reasons:
- Built-in Kubernetes Service Discovery: Prometheus automatically detects and monitors new services and pods as they are deployed and scaled within the Kubernetes cluster. This feature ensures that all components are consistently observed without manual intervention.
- Rich Data Model: It offers a detailed categorization and querying of metrics based on various attributes, such as pod labels, namespaces, and service names. This granularity allows for precise monitoring and analysis.
- Integration with Visualization Tools: Prometheus integrates seamlessly with Grafana, enabling users to create custom dashboards and visualizations. This integration helps in gaining deeper insights into Kubernetes metrics and enhances decision-making.
- Scalability and Performance: Designed to handle large volumes of data efficiently, Prometheus maintains minimal resource overhead, making it ideally suited for the dynamic and expansive nature of Kubernetes environments.
- Proven Reliability: Many organizations, ranging from small startups to large enterprises, rely on Prometheus for monitoring their Kubernetes infrastructures. Its effectiveness in adapting to the constantly changing environment of Kubernetes has been well-documented and trusted.
- Robust Community Support: Both Prometheus and Kubernetes are part of the CNCF, benefiting from a broad community that contributes powerful documentation, tutorials, and ongoing support.
- Open-Source Flexibility: Being open-source, Prometheus allows for extensive customization and adaptability, catering to specific monitoring needs and scenarios in Kubernetes.
What is Grafana?
Grafana is an open-source, multi-platform analytics and visualization web application. When integrated with supported data sources such as Prometheus, Grafana provides a powerful suite of features including:
- Interactive Dashboards: Craft comprehensive and customizable views of your real-time data.
- Interactive Charts: Delve into your metrics with dynamic charts that highlight trends and patterns.
- Graphs: Visualize data points over time with detailed graphs.
- Web Alerts: Set up alerts to notify you of significant changes or anomalies in your data.
What is kube-prometheus-stack?
The kube-prometheus-stack Helm chart offers the most straightforward method to deploy a comprehensive Prometheus setup within your Kubernetes cluster. This chart automates the deployment of multiple integral components, ensuring a cohesive monitoring ecosystem:
- Prometheus: At the heart of the stack, Prometheus serves as the time-series database that scrapes, stores, and exposes metrics from your Kubernetes environment and its applications.
- Node-Exporter: A critical exporter within the Prometheus architecture, Node-Exporter gathers resource utilization data from the nodes in your Kubernetes cluster. The kube-prometheus-stack chart seamlessly deploys this exporter and configures Prometheus to scrape its data.
- Kube-State-Metrics: This exporter provides vital data to Prometheus by exposing details about the API objects in your Kubernetes cluster, such as pods and containers.
- Grafana: Direct querying of Prometheus can be cumbersome; Grafana addresses this by serving as an observability platform that integrates with multiple data sources, including Prometheus. It allows for the creation of detailed dashboards that visualize and make sense of the Prometheus data effectively.
- Alertmanager: A standalone component of Prometheus, Alertmanager handles notifications and alerts based on metric changes. It enables configurations such as sending emails when CPU utilization spikes or Slack messages if a pod is evicted, enhancing real-time operational awareness.
This Helm chart simplifies the process of setting up a robust monitoring framework, making it easier to maintain visibility and control over the performance and health of your Kubernetes cluster.
To complete this tutorial, you will need:
Before beginning the installation of Prometheus and Grafana on your Kubernetes cluster, ensure you have the following prerequisites set up and ready:
- Install Docker: Docker is essential for running containerized applications. Follow the official Docker documentation to install Docker on your machine.
- Install kubectl: kubectl is the command-line tool that lets you control Kubernetes clusters. Follow the instructions in the official kubectl documentation to install it on your local machine.
- Install helm:. Helm is the official package manager for Kubernetes. With Helm, you can streamline Kubernetes application installation, deployment, and management
- Set Up a Kubernetes Cluster: For this guide, we will use Kind which is a free and simple way to run Kubernetes locally. Follow the kind installation guide to set up your local Kubernetes cluster.
How to set up Prometheus monitoring on a Kubernetes cluster
1.Prometheus Helm Charts
First, we’ll search for the Prometheus Helm Charts. To search for the Prometheus Helm, run this command:
helm search hub prometheusThe command lists the following Prometheus Helm Charts:
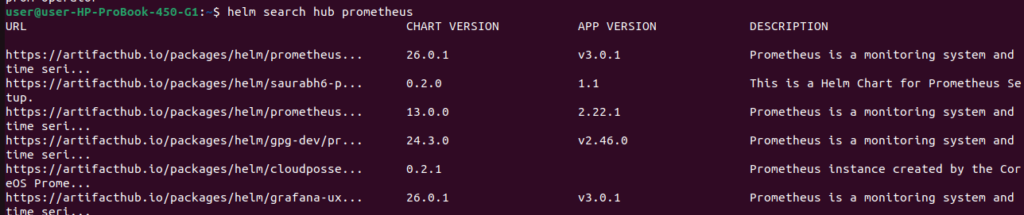
You can also go to the ArtifactHub repository and search for the official Prometheus Helm Chart as shown in the image below:
Run the following commands to add the Prometheus helm chart
helm repo add prometheus-community https://prometheus-community.github.io/helm-charts
helm repo update
You can list the available charts after adding the repo using below command
helm search repo prometheus-communityThe output looks similar to the following:
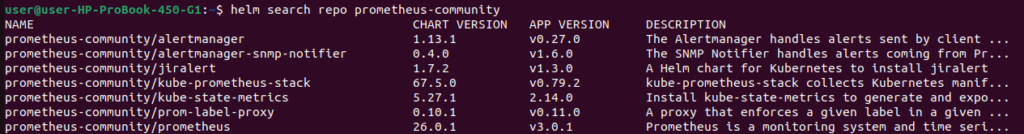
Now we have downloaded the latest version of the Prometheus & Grafana.
The chart
prometheus-community/kube-prometheus-stack, is designed to deploy Prometheus, Promtail, Alertmanager, and Grafana on your Kubernetes cluster. For comprehensive details about this chart, please refer to the kube-prometheus-stack page.
2.Install Prometheus Helm Chart on Kubernetes Cluster
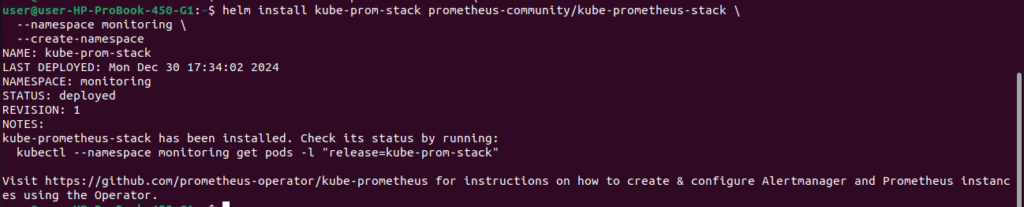
To install Prometheus Helm Chart on Kubernetes Cluster, let’s run the following command:
helm install kube-prom-stack prometheus-community/kube-prometheus-stack \
--namespace monitoring \
--create-namespace
Here’s a breakdown of the command we using :
helm install kube-prom-stack: This initiates the installation of the Helm chart.kube-prom-stackis the name given to this particular deployment, which you can refer to when managing the deployment through Helm commands.prometheus-community/kube-prometheus-stack: Specifies the chart to install. In this case, it’s thekube-prometheus-stackchart from theprometheus-communityHelm repository, which includes Prometheus, Grafana, Alertmanager, and other related monitoring components.--namespace monitoring: This flag specifies that the Helm chart should be installed in themonitoringnamespace within the Kubernetes cluster. If this namespace does not already exist, it will be created due to the next flag.--create-namespace: This option tells Helm to create themonitoringnamespace if it doesn’t already exist. This is useful for ensuring that the installation proceeds without requiring a separate step to manually create the namespace.
It can take a couple of minutes for the chart’s components to start. Run the following command to check the status of components
kubectl get po -n monitoring
Once all the Pods show as Running, your monitoring stack is ready to use. The data exposed by the exporters will be automatically scraped by Prometheus.
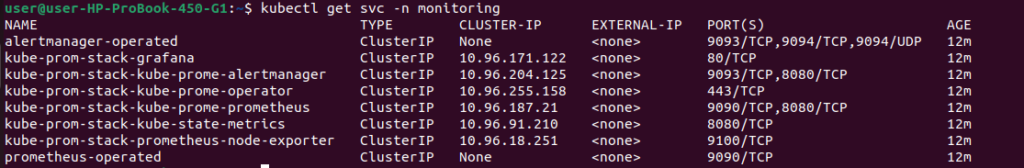
How to expose prometheus & grafana services
kube-prom-stack-grafana and kube-prom-stack-kube-prome-prometheus are the ClusterIP type services which means we can only access them within the Kubernetes cluster.
To expose Prometheus and Grafana for access outside the Kubernetes cluster, you can use NodeIP, port forwarding, or a LoadBalancer service.
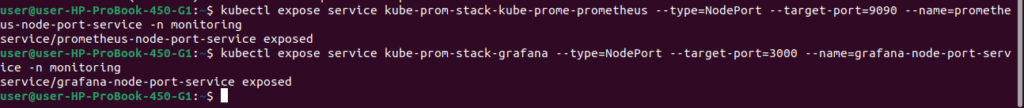
Let’s run the following command, to expose the Prometheus Kubernetes service:
kubectl expose service kube-prom-stack-kube-prome-prometheus --type=NodePort --target-port=9090 --name=prometheus-node-port-service -n monitoring
To expose the Grafana service run the following command:
kubectl expose service kube-prom-stack-grafana --type=NodePort --target-port=3000 --name=grafana-node-port-service -n monitoring
This command will create new NodePort services, making Prometheus and Grafana accessible outside the Kubernetes Cluster on ports 9090 and 80, respectively.
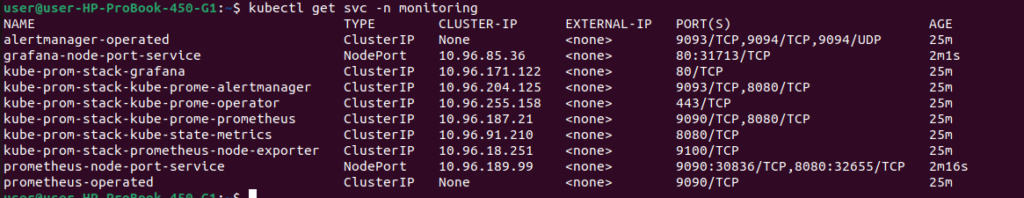
As we can see, the grafana-node-port-service and prometheus-node-port-service are successfully created and are being exposed on node ports 31713 & 30836
Now, we can run this command and get the external IP of any node to access the Prometheus and Grafana:
kubectl get nodes -o wide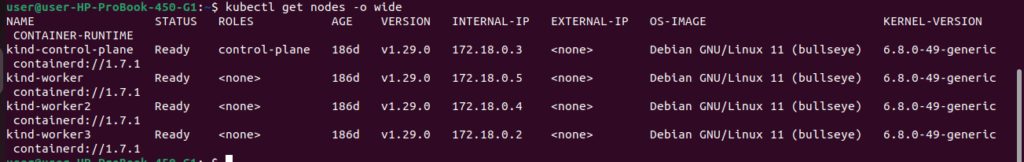
We can use the External-IP and the node ports to access the Prometheus and Grafana dashboards outside the cluster environment.
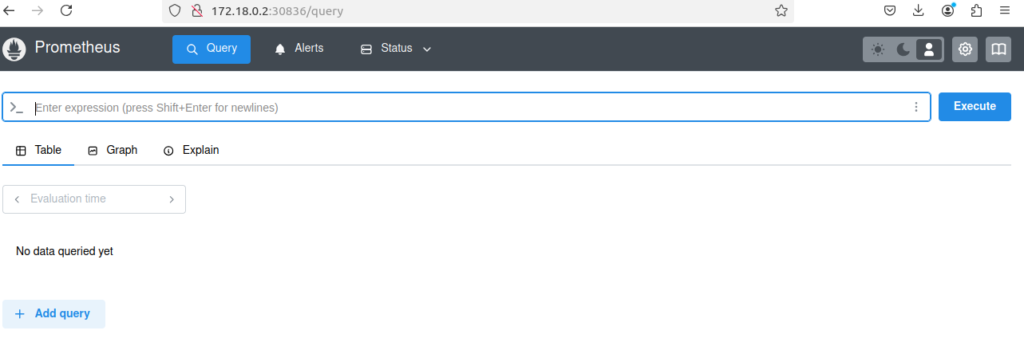
Prometheus Dashboard
Grafana UI:
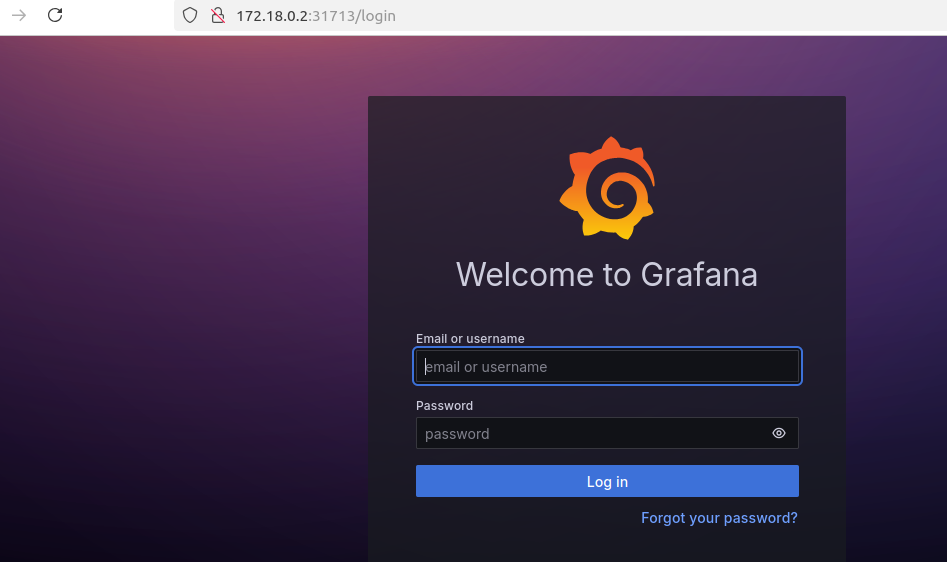
The image above shows the Grafana Login page. To get the password for admin, run this command
kubectl get secret --namespace monitoring kube-prom-stack-grafana -o jsonpath="{.data.admin-password}" | base64 --decode ; echoThe default user account is admin with a password of prom-operator.
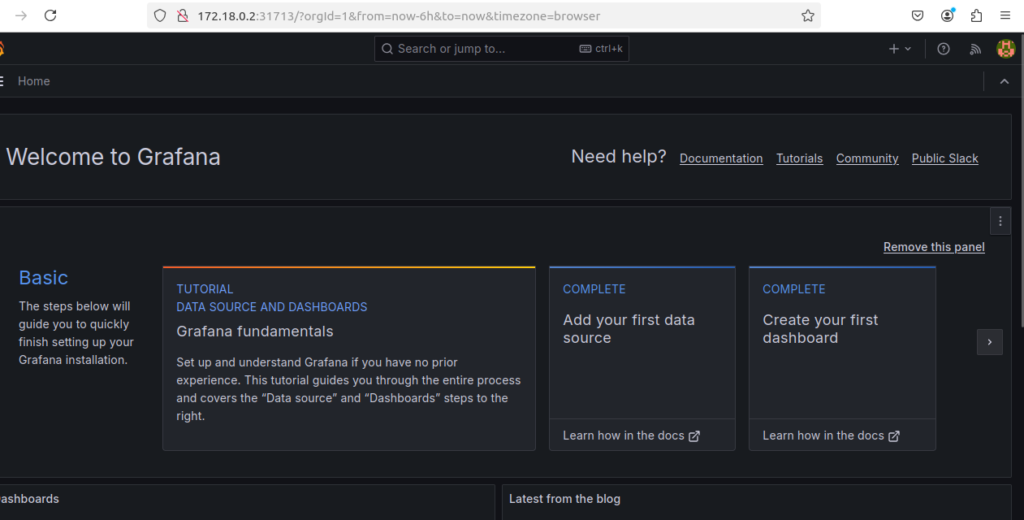
Grafana Dashboard
Upon login to the Grafana dashboard use admin as the username and our generated password. We will see “Welcome to Grafana” homepage as shown below.
Since we used the Kube Prometheus Stack helm chart, the data source for Prometheus and Alert Manager is added by default.
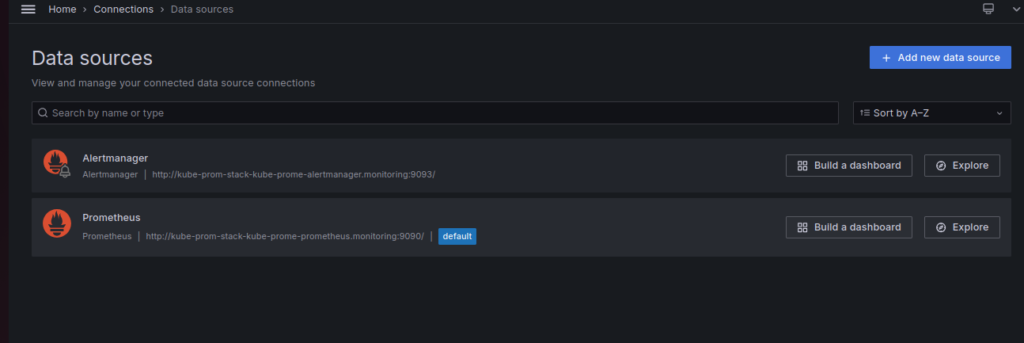
We can add more data sources, by clicking on the Add new data source button on the top right side.
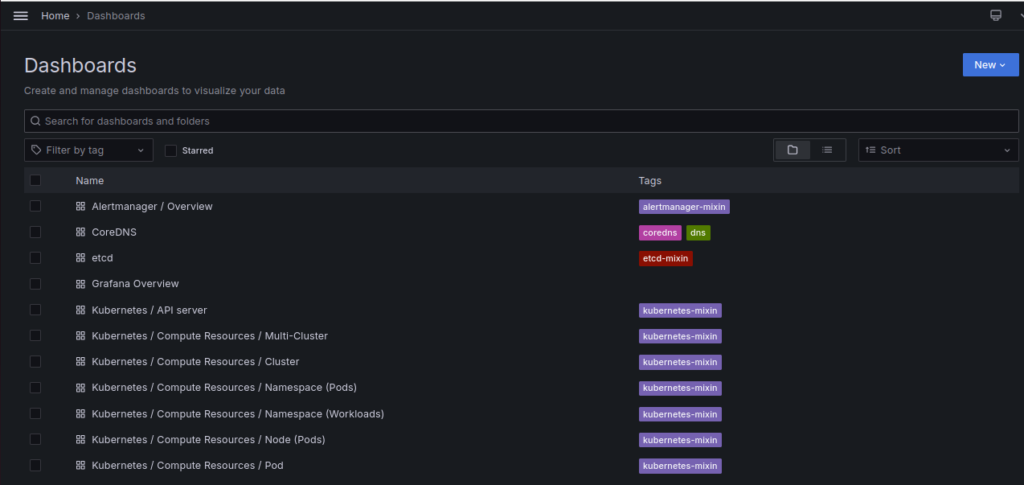
Explore the Grafana pre-built dashboards
By default, this Helm chart adds multiple dashboards to monitor the health of the Kubernetes cluster and its resources.. Here are a few important ones
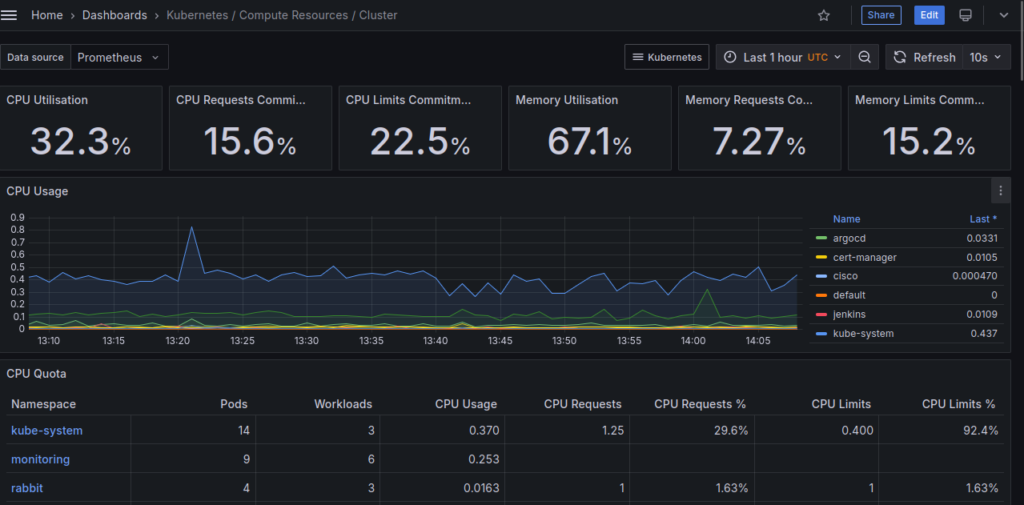
Monitoring cluster utilization with “Kubernetes / Compute Resources / Cluster”
This dashboard offers an overview of resource utilization across your entire cluster. Key statistics are displayed at the top, while more detailed information is presented in the panels below.
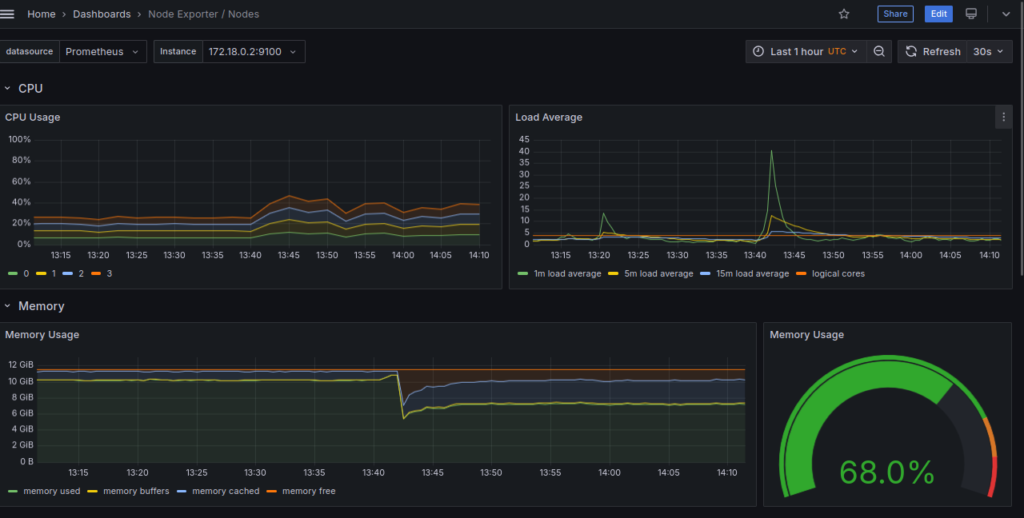
Viewing a node’s resource consumption with “Node Exporter / Nodes”
The data collected by Node-Exporter is displayed on this dashboard, which provides detailed information on resource utilization on a per-node basis. You can select different nodes using the “instance” dropdown at the top of the dashboard.
Additionally, we also have the option of creating our dashboards from scratch as well as importing multiple Grafana dashboards provided by the Grafana library.
Conclusion
Effective observability is crucial for managing Kubernetes clusters, especially those running production workloads. Understanding resource utilization, tracking pod scheduling, and monitoring errors and logs emitted by applications are fundamental to maintaining a robust environment.
The Kube-Prometheus-Stack offers a streamlined approach to establishing comprehensive monitoring for your cluster. It automatically sets up Prometheus, Grafana, Alertmanager, and essential metrics exporters, significantly reducing maintenance efforts. The basic installation includes prebuilt dashboards that are not only useful out-of-the-box but also customizable, allowing you to incorporate custom queries and metrics from your own applications.